RSS

How Tariffs Affect Vancouver’s Housing Market — What Buyers & Sellers Should Know

🔑 What Are Tariffs, and Why Should You Care?

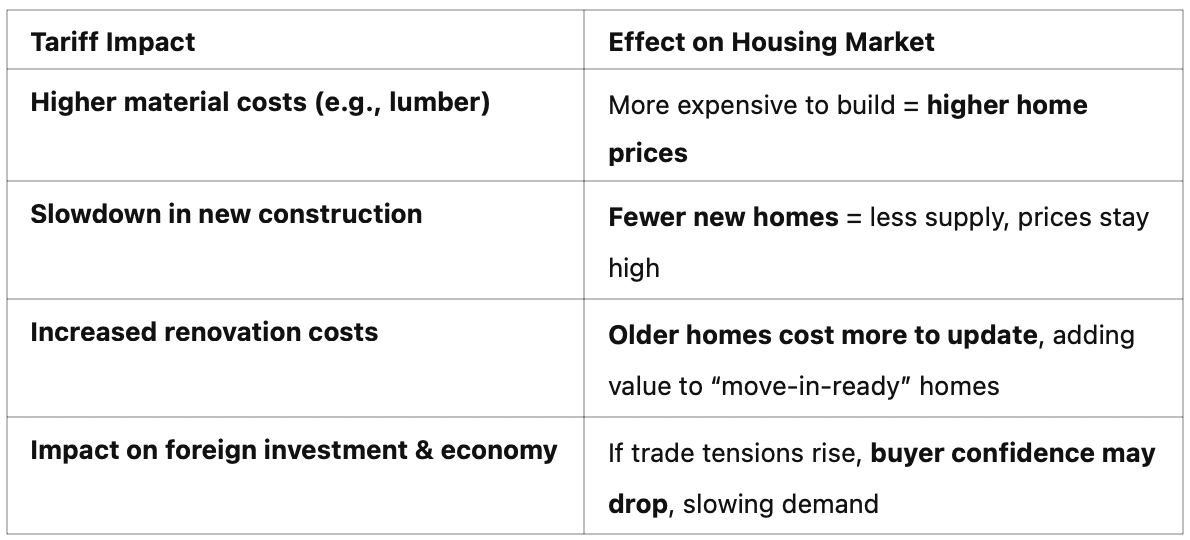
Tariffs are extra costs added to goods imported into Canada — including lumber, steel, appliances, and other materials used to build homes.

➡️ When tariffs go up, building costs often rise too.

➡️ Higher costs = more expensive homes.

Whether you’re a first-time buyer or planning to sell, tariffs can shape the housing market — sometimes in surprising ways!

📊 Here’s How Tariffs May Impact Vancouver’s Housing Market:

💡 What This Means for You (as a Buyer or Seller):

For Buyers:

Prices may stay elevated in some segments, but watching for slowdowns could offer opportunities.

Move-in-ready homes might be more attractive (and competitive) due to higher renovation costs.

For Sellers:

• If you’re selling a turnkey property, buyers may value it more than ever.

• With fewer new builds coming up, your resale home could stand out.


🔍 Bottom Line:

Tariffs might not be front-page news, but they quietly impact your buying and selling decisions.

If you’re curious about how to navigate these trends, reach out — I’m always here to help you make sense of the market and plan your next move confidently.

📞 Let’s Chat!

Thinking about buying or selling this year? Let’s grab a coffee or chat over Zoom to make a game plan.

👉 Reply to this email, or click here to book a time with me.


Stay cozy,

Mild 🏡 

Your Trusted Friend in Real Estate

Read

Metro Vancouver Real Estate Update: May 2024

Hey everyone,

We’ve got the latest scoop on the Metro Vancouver real estate scene, and it’s a mixed bag this May! Here’s what’s buzzing:

Sales Dip While Listings Soar:

  • Home sales in Metro Vancouver took a breather in May, dropping 19.9% from last year. Only 2,733 homes exchanged hands this month, quite the dip from the 3,411 sales in May 2023.

  • However, the inventory is building up! Over 13,000 homes are now listed on the MLS®, a whopping 46.3% increase from last year.

What’s Cooking in the Market?

  • Andrew Lis from Greater Vancouver REALTORS® explains the sales dip is due to a cocktail of higher borrowing costs, economic jitters, and new government policies.

  • Despite the slowdown, new listings are on the rise, with a 12.6% increase from last year. Looks like sellers are feeling optimistic!

Price Trends:

  • The MLS® Home Price Index (HPI) benchmark for all residential properties sits at $1,212,000. That’s a 2.3% bump from last year and a slight 0.5% rise from April.

  • Detached homes are going for around $2,062,600, a 5.9% hike from last year.

  • Apartments are priced at $776,200, up 2.2% year-over-year.

  • Townhouses are now at $1,145,600, marking a 5.2% increase.

Sales-to-Listings Ratio:

  • The overall sales-to-active listings ratio is 20.8%, indicating a balanced market. By property type, detached homes are at 16.8%, attached homes at 25.1%, and apartments at 22.5%.

  • Historically, prices climb when this ratio is over 20% for several months, so keep an eye out!

What’s Next?

  • With inventory rising and demand softening, we might see slower price growth in the coming months. Good news for buyers looking for a summer deal, even with those high borrowing costs!

Stay tuned for more updates and happy house hunting!

Mild Homes 

Read

Closing Costs for Buyers

When purchasing a home, it's crucial to plan for closing costs in addition to the purchase price. While the down payment is a major focus, there are other important fees that come with closing the deal. Here's a detailed breakdown of these costs, including transaction expenses and other key considerations:Transaction Expenses

1. Property Transfer Tax (PTT)

PTT is a sales tax levied by the British Columbia government on all real estate transactions within the province. The rates are:

• 1% on the first $200,000

• 2% on the portion between $200,000 and $2 million

• 3% on the portion above $2 million

Note: PTT is not applied to the GST portion when applicable.

PTT Exemptions:

First-Time Home Buyers: If you're purchasing your first home, you are exempt from PTT if the home is priced at $835,000 or less (effective April 1, 2024). Partial exemptions apply to homes between $550,000 and $835,000, but no exemption exists for homes priced above $835,000.

Co-Purchases: If only one buyer is a first-time homebuyer, the exemption applies only to that person’s portion of the property.

Residency Requirement: To qualify for the first-time buyer exemption, you must reside in the home for at least one year after purchase.

2. Newly Built Homes

Before April 1, 2024: For properties registered before this date, the fair market value plus construction costs must be below $500,000 (or $525,000 for partial exemptions) to qualify for an exemption.

After April 1, 2024: For homes registered on or after this date, the property’s value plus construction costs must be under $835,000 (or $860,000 for partial exemptions). Additionally, you must move into the home within one year of the registration date.

Other Costs

3. Legal/Notary Fees

To complete the legal paperwork, expect to pay between $1,000 and $1,650 for notary or lawyer services.

4. Property Tax Adjustments

Buyers may need to reimburse the seller for any prepaid property taxes. If you have a mortgage, the lender may require monthly payments for property tax. Your notary or lawyer will handle these calculations.

5. Home Inspection

A home inspection, though optional, is highly recommended and typically costs between $500 and $900 depending on the property’s size and features.

6. Insurance

Most lenders will require property insurance, particularly fire insurance. Additional types of insurance may also be required.

7. Appraisal

Some lenders require an appraisal to confirm the home’s market value, which usually costs between $300 and $500. Your mortgage broker may cover this cost.

8. Mortgage Insurance

If your down payment is under 20%, you'll need mortgage insurance from CMHC. The premium is added to your mortgage, but there’s a small application fee. Speak to your mortgage specialist for more details.

9. Title Insurance

Title insurance protects you and your lender from potential issues related to the property title. Costs can vary, so consult with your lawyer or mortgage broker for specifics.

10. Goods and Services Tax (GST)

A 5% GST applies to the purchase of new homes. Some rebates are available for homes under $450,000. Make sure to clarify any exemptions with your lawyer or notary.

11. Strata Fees

If you’re buying a strata unit, there will be monthly strata fees for maintenance and upkeep, typically due on the first of each month.

12. Move-In Fee (Strata Units)

This fee, charged by strata units, is applicable upon moving in.

13. Adjustments

At closing, you may need to reimburse the seller for prepaid utilities or strata fees on a pro-rated basis.

14. Moving Costs

Relocation expenses will vary depending on the distance and whether you hire professional movers or handle it yourself.

Final Thoughts

Understanding these costs will give you a clearer picture of what to expect when closing on your new home. If you have any questions or need further assistance, don't hesitate to reach out—I'm here to help!

Read

December 2023 Year End Market Summary

Metro Vancouver Housing Market Update - December 2023

  • Residential sales in Metro Vancouver for 2023 totaled 26,249, marking a 10.3% decrease from 2022 and a 41.5% decrease from 2021. Despite this, the market closed the year with balanced conditions.

  • The year-end totals mask the market's surprising resilience in the face of the highest borrowing costs in over a decade.

  • Properties listed on the MLS® in 2023 totaled 50,893, a 7.5% decrease from 2022 and 20.2% below 2021, ending 10.5% below the 10-year annual average.

  • Currently, the total number of homes listed for sale on the MLS® system in Metro Vancouver is 8,802, a 13% increase from December 2022 and 0.3% above the 10-year seasonal average.

  • The MLS® Home Price Index composite benchmark price for all residential properties is $1,168,700, showing a 5% increase over December 2022 and a 1.4% decrease compared to November 2023.

  • December 2023 saw 1,345 residential sales, a 3.2% increase from December 2022, but 36.4% below the 10-year seasonal average.

  • There were 1,327 newly listed properties in December 2023, a 9.9% increase from December 2022, but 22.7% below the 10-year seasonal average.

  • The sales-to-active listings ratio for December 2023 is 16%, with ratios of 11.1% for detached homes, 18.7% for attached, and 19.6% for apartments.

  • Downward pressure on home prices is suggested when the ratio dips below 12%, while upward pressure occurs when it surpasses 20%.

  • Sales of detached homes in December 2023 reached 376, a 1.3% increase from December 2022, with a benchmark price of $1,964,400 (7.7% increase from December 2022, 0.9% decrease from November 2023).

  • Apartment home sales totaled 719 in December 2023, a 2.4% increase from December 2022, with a benchmark price of $751,300 (5.6% increase from December 2022, 1.5% decrease from November 2023).

  • Attached home sales in December 2023 were 238, a 7.2% increase from December 2022, with a benchmark price of $1,072,700 (6.4% increase from December 2022, 1.8% decrease from November 2023).

    Downtown the December Stats Package

Read

November 2023 Market Summary

Metro Vancouver Housing Market Update - November 2023

  • Residential sales in Metro Vancouver for November 2023 were 1,702, marking a 4.7% increase from November 2022 but remaining 33% below the 10-year seasonal average.

  • The increase in active listings, with 3,369 properties newly listed in November 2023, a 9.8% rise from November 2022, has provided home buyers with a larger selection.

  • The total number of properties listed for sale on the MLS® system in Metro Vancouver is 10,931, a 13.5% increase compared to November 2022, and 3.7% above the 10-year seasonal average.

  • The sales-to-active listings ratio for November 2023 is 16.3%, indicating a more balanced market, with ratios of 12.7% for detached homes, 19.8% for attached, and 18.2% for apartments.

  • Balanced market conditions are associated with flatter price trends, seen since the summer months, following a period of over seven percent price increase earlier in the year.

  • The MLS® Home Price Index composite benchmark price for all residential properties is $1,185,100, showing a 4.9% increase over November 2022 and a 1% decrease compared to October 2023.

  • Detached home sales in November 2023 reached 523, a 7% increase from November 2022, with a benchmark price of $1,982,600 (6.8% increase from November 2022, 0.9% decrease from October 2023).

  • Apartment home sales totalled 850, a 0.4% increase from November 2022, with a benchmark price of $762,700 (6.2% increase from November 2022, 1% decrease from October 2023).

  • Attached home sales in November 2023 were 316, a 12.5% increase from November 2022, with a benchmark price of $1,092,600 (6.9% increase from November 2022, 0.7% decrease from October 2023).

Downtown the November Stats Package

Read

October 2023 Market Summary

Metro Vancouver Housing Market Update - October 2023

  • Residential sales in Metro Vancouver for October 2023 reached 1,996, a 3.7% increase from October 2022, but still 29.5% below the 10-year seasonal average.

  • The increase in newly listed properties (4,664 in October 2023) gives buyers more choices, with a 15.4% rise compared to October 2022 and 4.8% above the 10-year seasonal average.

  • However, the sales-to-active listings ratio for October 2023 is 17.9%, indicating a market favoring buyers, as a ratio below 12% puts downward pressure on prices.

  • The total number of properties listed for sale in Metro Vancouver is 11,599, a 12.6% increase from October 2022, and 0.6% above the 10-year seasonal average.

  • The multifamily segment is more active than the detached segment, contributing to more balanced market conditions.

  • The MLS® Home Price Index composite benchmark price for all residential properties is $1,196,500, a 4.4% increase over October 2022 but a 0.6% decrease compared to September 2023.

  • Detached home sales reached 577 in October 2023, a 0.7% decrease from October 2022, with a benchmark price of $2,001,400 (5.8% increase from October 2022).

  • Apartment home sales totaled 1,044, a 4.9% increase from October 2022, with a benchmark price of $770,200 (6.4% increase from October 2022).

  • Attached home sales in October 2023 were 356, a 6.6% increase from October 2022, with a benchmark price of $1,100,500 (6% increase from October 2022).

Download the October 2023 stats package.

Read

September 2023 Market Summary

Metro Vancouver Housing Market Update - September 2023

September witnessed a seasonal lull in the Metro Vancouver housing market, contrasting the earlier price hikes of the year. Key takeaways:

  1. Increased Inventory: The month saw a dip in sales but an uptick in property listings, which led to a modest growth in the region's inventory.
  2. Sales Data: Home sales clocked in at 1,926, marking a 13.2% rise from September 2022 but remaining 26.3% below the decade's seasonal average.
  3. High Mortgage Rates: The decade-high mortgage rates have made homeowners hesitant to list. This earlier led to a scarcity in listings and a consequent price surge.
  4. Listing Numbers: New property listings for September stood at 5,446, up by 28.4% from the previous year and 5.2% above the decade's average.
  5. Sales-to-Listings Ratio: The overall sales-to-active listings ratio was 17.7%. Historically, prices tend to face downward pressure below a 12% ratio and upward pressure above 20%.
  6. Market Revival: Andrew Lis from REBGV noted a renewed seller interest, aligning listings with historical averages and pointing towards a market equilibrium.
  7. Property Benchmarks:
    • Overall properties: $1,203,300 (up 4.4% YoY, down 0.4% from August).
    • Detached homes: $2,017,100 (up 5.8% YoY, slight 0.1% dip from August).
    • Apartments: $768,500 (up 5.8% YoY, down 0.2% from August).
    • Attached homes: $1,098,400 (up 5.3% YoY, down 0.5% from August).

In summary, while the spring and summer periods showcased a seller's market due to limited listings, September ushered in a more balanced scenario, courtesy of an inventory boost and the typical fall slowdown.


Download SEPTEMBER 2023 Stat Package here 

Read

Home prices continue to rise in Metro Vancouver’s housing market to kick off the summer


Continuing the trend that has emerged in the housing market this year, the benchmark price for all home types in Metro Vancouver1 increased in June as home buyer demand butted up against a limited inventory of homes for sale in the region.

The Real Estate Board of Greater Vancouver (REBGV) reports that residential home sales2 in the region totalled 2,988 in June 2023, a 21.1 per cent increase from the 2,467 sales recorded in June 2022. This was 8.6 per cent below the 10-year seasonal average (3,269).

“The market continues to outperform expectations across all segments, but the apartment segment showed the most relative strength in June,” Andrew Lis, REBGV’s director of economics and data analytics said. “The benchmark price of apartment homes is almost cresting the peak reached in 2022, while sales of apartments are now above the region’s ten-year seasonal average. This uniquely positions the apartment segment relative to the attached and detached segments where sales remained below the ten-year seasonal averages.”

There were 5,348 detached, attached and apartment properties newly listed for sale on the Multiple Listing Service® (MLS®) in Metro Vancouver in June 2023. This represents a 1.3 per cent increase compared to the 5,278 homes listed in June 2022. This was 3.1 per cent below the 10-year seasonal average (5,518).

The total number of homes currently listed for sale on the MLS® system in Metro Vancouver is 9,990, a 7.9 per cent decrease compared to June 2022 (10,842) This was 17.4 per cent below the 10-year seasonal average (12,091).

Across all detached, attached and apartment property types, the sales-to-active listings ratio for June 2023 is 31.4 per cent. By property type, the ratio is 20.9 per cent for detached homes, 38.5 per cent for townhomes, and 39.4 per cent for apartments.

Analysis of the historical data suggests downward pressure on home prices occurs when the ratio dips below 12 per cent for a sustained period, while home prices often experience upward pressure when it surpasses 20 per cent over several months.

“Despite elevated borrowing costs, there continues to be too little resale inventory available relative to the pool of buyers in Metro Vancouver. This is the fundamental reason we continue to see prices increase month over month across all segments,” Lis said. “With the benchmark price for apartments now standing at $767,000, we repeat our call to the provincial government to adjust the $525,000 threshold exempting first-time home buyers from the Property Transfer Tax to better reflect the price of entry-level homes in our region. This is a simple policy adjustment that could help more first-time buyers afford a home right now.”  

The MLS® Home Price Index composite benchmark price for all residential properties in Metro Vancouver is currently $1,203,000. This represents a 2.4 per cent decrease over June 2022 and a 1.3 per cent increase compared to May 2023.

Sales of detached homes in June 2023 reached 848, a 28.3 per cent increase from the 661 detached sales recorded in June 2022. The benchmark price for a detached home is $1,991,300. This represents a 3.2 per cent decrease from June 2022 and a 1.9 per cent increase compared to May 2023.

Sales of apartment homes reached 1,573 in June 2023, an 18.6 per cent increase compared to the 1,326 sales in June 2022. The benchmark price of an apartment home is $767,000. This represents a 0.5 per cent increase from June 2022 and a 0.8 per cent increase compared to May 2023.

Attached home sales in June 2023 totalled 547, a 17.6 per cent increase compared to the 465 sales in June 2022. The benchmark price of an attached home is $1,098,900. This represents a one per cent decrease from June 2022 and a 1.5 per cent increase compared to May 2023.

Download the June 2023 stats package.

Read

Seasonal slowdown brings price stability to Metro Vancouver

As summer winds to a close, higher borrowing costs have begun to permeate the Metro Vancouver housing market in predictable ways, with price gains cooling and sales slowing along the typical seasonal pattern. 

The Real Estate Board of Greater Vancouver (REBGV) reports that residential home sales in the region totalled 2,296 in August 2023, a 21.4 per cent increase from the 1,892 sales recorded in August 2022. This was 13.8 per cent below the 10-year seasonal average (2,663). 

“It’s been an interesting spring and summer market, to say the least” Andrew Lis, REBGV’s director of economics and data analytics said. “Borrowing costs are fluctuating around the highest levels we’ve seen in over ten years, yet Metro Vancouver’s housing market bucked many pundits’ predictions of a major slowdown, instead posting relatively strong sales numbers and year-to-date price gains north of eight per cent, regardless of home type.” 

There were 3,943 detached, attached and apartment properties newly listed for sale on the Multiple Listing Service® (MLS®) in Metro Vancouver in August 2023. This represents an 18.1 per cent increase compared to the 3,340 homes listed in August 2022. This was 5.3 per cent below the 10-year seasonal average (4,164). 

The total number of homes currently listed for sale on the MLS® system in Metro Vancouver is 10,082, a 0.2 per cent decrease compared to August 2022 (10,099). This was 13.4 per cent below the 10-year seasonal average (11,647). 

Across all detached, attached and apartment property types, the sales-to-active listings ratio for August 2023 is 23.9 per cent. By property type, the ratio is 14.2 per cent for detached homes, 30.3 per cent for townhomes, and 31.9 per cent for apartments. 

Analysis of the historical data suggests downward pressure on home prices occurs when the ratio dips below 12 per cent for a sustained period, while home prices often experience upward pressure when it surpasses 20 per cent over several months. 

“It’s a bit of a tortoise and hare story this year, with sales starting the year slowly while prices increased due to low inventory levels,” Lis said. “As fall approaches, sales have caught up with the price gains, but both metrics are now slowing to a pace that is more in-line with historical seasonal patterns, and with what one might expect given that borrowing costs are where they are.” 

The MLS® Home Price Index composite benchmark price for all residential properties in Metro Vancouver is currently $1,208,400. This represents a 2.5 per cent increase over August 2022 and a 0.2 per cent decrease compared to July 2023. 

Sales of detached homes in August 2023 reached 591, a 13.2 per cent increase from the 522 detached sales recorded in August 2022. The benchmark price for a detached home is $2,018,500. This represents a 3.3 per cent increase from August 2022 and a 0.3 per cent increase compared to July 2023. 

Sales of apartment homes reached 1,270 in August 2023, a 27.4 per cent increase compared to the 997 sales in August 2022. The benchmark price of an apartment home is $770,000. This represents a 4.4 per cent increase from August 2022 and a 0.2 per cent decrease compared to July 2023. 

Attached home sales in August 2023 totalled 422, an 18.9 per cent increase compared to the 355 sales in August 2022. The benchmark price of an attached home is $1,103,900. This represents a 3.9 per cent increase from August 2022 and a 0.1 per cent decrease compared to July 2023. 

Download the August 2023 stats package.

Read
Reciprocity Logo The data relating to real estate on this website comes in part from the MLS® Reciprocity program of either the Greater Vancouver REALTORS® (GVR), the Fraser Valley Real Estate Board (FVREB) or the Chilliwack and District Real Estate Board (CADREB). Real estate listings held by participating real estate firms are marked with the MLS® logo and detailed information about the listing includes the name of the listing agent. This representation is based in whole or part on data generated by either the GVR, the FVREB or the CADREB which assumes no responsibility for its accuracy. The materials contained on this page may not be reproduced without the express written consent of either the GVR, the FVREB or the CADREB.